At the end of period 4 of the 2026-27 fiscal year, 126,209 people were waiting for surgery in Quebec, and 20.8% of them had been waiting more than 6 months since the surgeon decided to operate. Among regions, this share ranges from 7.3% in Saguenay–Lac-Saint-Jean to 29.7% in Outaouais. By specialty, plastic surgery has the highest share (37.9%) and ophthalmology the lowest (12.0%). Compared with the same period a year earlier, and leaving out Mauricie and Centre-du-Québec (missing from this year's file), the share went from 25.4% to 20.8%, and the number of people waiting more than a year from 6,069 to 3,822.
1. How this ranking works
This ranking compares one thing only: the share of people on the surgery waiting list who have been waiting more than 6 months. Lower is better. The wait is counted from the surgeon's decision to operate until the surgery, according to the Ministry of Health's methodology notes.
The figures come from the Ministry of Health's surgery waiting list file, published on Données Québec. It is a snapshot of the list at the end of period 4 of the 2026-27 fiscal year, read on November 4, 2026. The file is updated at the end of each financial period, 13 times a year, and we update this ranking each month. We receive no payment from any hospital.
A region with fewer than 500 people waiting is shown in the table but not ranked: with so few people, its share changes a lot from one period to the next. The Mauricie and Centre-du-Québec region is not in the file for this period.
The same file goes back to February 2020. Sections 4 to 7 compare the current situation with previous years and periods.
2. The ranking by region
Across Quebec, 20.8% of the 126,209 people on the list had been waiting more than 6 months, and 3,822 more than a year. When two regions show the same share, they share the same rank.
| Rank | Region | People waiting | Waiting more than 6 months | Waiting more than a year |
|---|---|---|---|---|
| 1 | Saguenay–Lac-Saint-Jean | 4,197 | 7.3% | 26 |
| 2 | Côte-Nord | 1,199 | 7.5% | 12 |
| 3 | Bas-Saint-Laurent | 2,418 | 10.0% | 7 |
| 4 | Gaspésie–Îles-de-la-Madeleine | 835 | 10.2% | 14 |
| 5 | Capitale-Nationale | 15,493 | 18.2% | 417 |
| 6 | Estrie | 9,417 | 18.3% | 191 |
| 7 | Laurentides | 8,807 | 19.1% | 178 |
| 8 | Montréal | 35,731 | 20.4% | 822 |
| 9 | Montérégie | 19,453 | 21.9% | 434 |
| 10 | Chaudière-Appalaches | 8,130 | 23.4% | 264 |
| 11 | Laval | 5,090 | 26.6% | 262 |
| 12 | Abitibi-Témiscamingue | 2,388 | 28.6% | 117 |
| 13 | Lanaudière | 7,223 | 29.1% | 402 |
| 14 | Outaouais | 5,750 | 29.7% | 675 |
| — | Nord-du-Québec | 78 | 3.8% | 1 |
3. The ranking by specialty
The same criterion, for the whole of Quebec, by specialty. The last line covers procedures that are not surgery but need a general anesthetic in the operating room. Cardiac surgery is only partly included in the data.
| Rank | Specialty | People waiting | Waiting more than 6 months | Waiting more than a year |
|---|---|---|---|---|
| 1 | Ophthalmology | 28,315 | 12.0% | 259 |
| 2 | Urology | 9,470 | 18.1% | 303 |
| 3 | Other procedures under general anesthesia | 9,602 | 19.8% | 245 |
| 3 | General surgery | 19,177 | 19.8% | 506 |
| 5 | Vascular surgery | 1,165 | 20.3% | 69 |
| 6 | Obstetrics and gynecology | 7,997 | 20.7% | 187 |
| 7 | ENT and head and neck surgery | 13,230 | 22.0% | 543 |
| 8 | Neurosurgery | 1,987 | 24.5% | 98 |
| 9 | Orthopedic surgery | 29,359 | 26.9% | 968 |
| 10 | Plastic surgery | 5,907 | 37.9% | 644 |
4. Compared with previous years
The Ministry of Health's file goes back to February 2020 and gives the list at the end of each period. Mauricie and Centre-du-Québec have been missing from it since period 2 of 2026-27. To compare like with like, the tables and charts in this section and the next leave that region out of every period. Without this precaution, the drop in the number of people waiting would look bigger than it is.
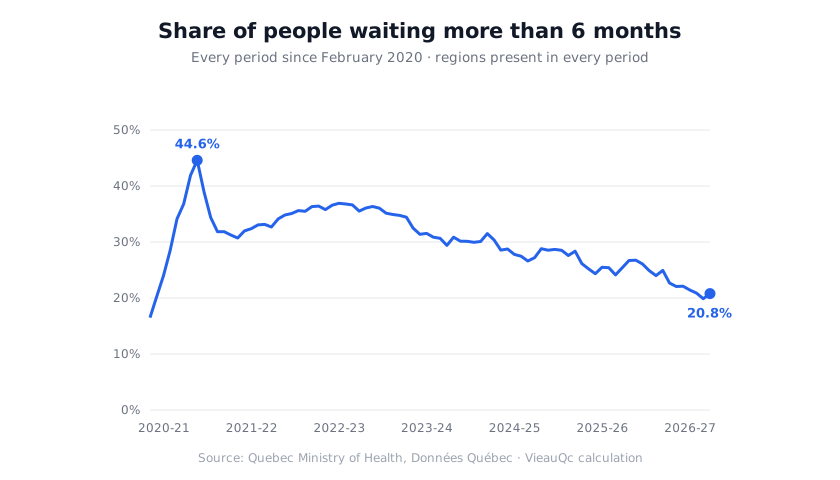
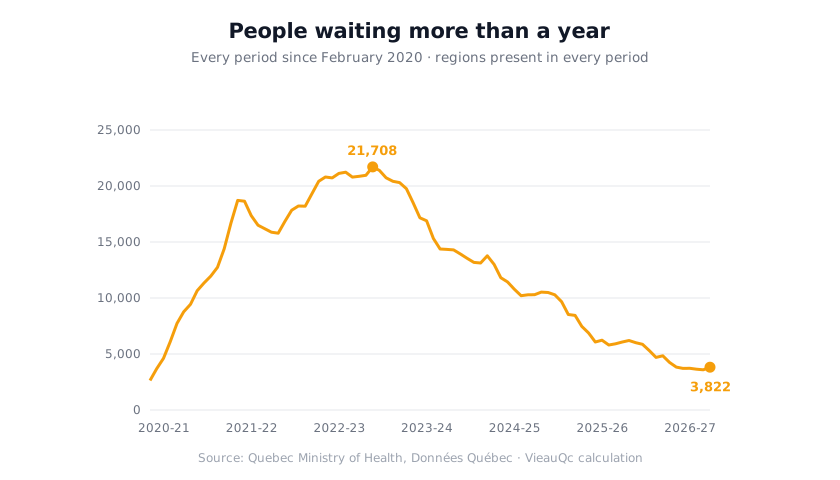
At period 4 of each year, the share of people waiting more than 6 months has fallen every year since 2022-23: in one year, it went from 25.4% to 20.8%. The number of people waiting more than a year went from 6,069 to 3,822, and the total number of people waiting from 140,482 to 126,209.
The peak came in 2020-21, during the COVID-19 pandemic: at period 6 that year, 44.6% of the people waiting had been waiting more than 6 months. The number of people waiting more than a year peaked later, at 21,708 people, at period 6 of 2022-23.
| Period | People waiting | Waiting more than 6 months | Waiting more than a year |
|---|---|---|---|
| Period 4, 2020-21 | 128,310 | 36.8% | 8,766 |
| Period 4, 2021-22 | 138,710 | 32.7% | 15,875 |
| Period 4, 2022-23 | 147,087 | 35.5% | 20,867 |
| Period 4, 2023-24 | 148,004 | 29.4% | 14,336 |
| Period 4, 2024-25 | 152,842 | 27.2% | 10,297 |
| Period 4, 2025-26 | 140,482 | 25.4% | 6,069 |
| Period 4, 2026-27 | 126,209 | 20.8% | 3,822 |
5. From one period to the next
Between period 3 and period 4 of 2026-27, the share of people waiting more than 6 months went from 19.9% to 20.8%, and the number of people waiting from 122,822 to 126,209. A single period does not make a trend: the table shows the last seven, still without Mauricie and Centre-du-Québec.
| Period | People waiting | Waiting more than 6 months | Waiting more than a year |
|---|---|---|---|
| Period 11, 2025-26 | 130,306 | 22.7% | 4,249 |
| Period 12, 2025-26 | 129,794 | 22.1% | 3,832 |
| Period 13, 2025-26 | 130,020 | 22.1% | 3,712 |
| Period 1, 2026-27 | 130,642 | 21.4% | 3,725 |
| Period 2, 2026-27 | 124,096 | 20.9% | 3,641 |
| Period 3, 2026-27 | 122,822 | 19.9% | 3,590 |
| Period 4, 2026-27 | 126,209 | 20.8% | 3,822 |
6. Each region, compared with last year
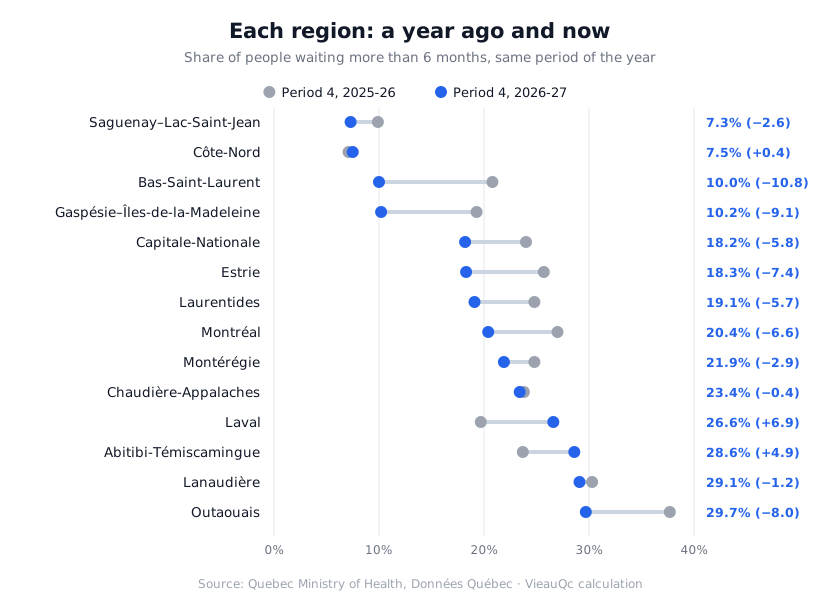
The table compares each region with the same period a year earlier (period 4 of 2025-26). The share of people waiting more than 6 months went up in 3 of the 14 ranked regions: Laval (+6.9 points), Abitibi-Témiscamingue (+4.9 points) and Côte-Nord (+0.4 point). It went down in the other 11; the largest drops are in Bas-Saint-Laurent (−10.8 points) and Gaspésie–Îles-de-la-Madeleine (−9.1 points).
Mauricie and Centre-du-Québec, missing from the file this year, had a share of 24.6% a year earlier. Nord-du-Québec, where fewer than 500 people are waiting, is shown but not ranked.
| Region | Period 4, 2025-26 | Period 4, 2026-27 | Change (points) | More than a year, 2025-26 | More than a year, 2026-27 |
|---|---|---|---|---|---|
| Saguenay–Lac-Saint-Jean | 9.9% | 7.3% | −2.6 | 9 | 26 |
| Côte-Nord | 7.1% | 7.5% | +0.4 | 0 | 12 |
| Bas-Saint-Laurent | 20.8% | 10.0% | −10.8 | 9 | 7 |
| Gaspésie–Îles-de-la-Madeleine | 19.3% | 10.2% | −9.1 | 70 | 14 |
| Capitale-Nationale | 24.0% | 18.2% | −5.8 | 516 | 417 |
| Estrie | 25.7% | 18.3% | −7.4 | 510 | 191 |
| Laurentides | 24.8% | 19.1% | −5.7 | 352 | 178 |
| Montréal | 27.0% | 20.4% | −6.6 | 1,752 | 822 |
| Montérégie | 24.8% | 21.9% | −2.9 | 762 | 434 |
| Chaudière-Appalaches | 23.8% | 23.4% | −0.4 | 333 | 264 |
| Laval | 19.7% | 26.6% | +6.9 | 0 | 262 |
| Abitibi-Témiscamingue | 23.7% | 28.6% | +4.9 | 154 | 117 |
| Lanaudière | 30.3% | 29.1% | −1.2 | 569 | 402 |
| Outaouais | 37.7% | 29.7% | −8.0 | 1,033 | 675 |
| Nord-du-Québec | 10.0% | 3.8% | −6.2 | 0 | 1 |
7. Each specialty, compared with last year
For the whole of Quebec, still without Mauricie and Centre-du-Québec, the share of people waiting more than 6 months went down in 8 of the 10 specialties. It went up in vascular surgery (+2.5 points) and plastic surgery (+1.9 point). Among the large specialties, the biggest drop is in orthopedic surgery (−6.7 points).
The line for other procedures under general anesthesia dropped more (−8.3 points), but the number of people in it rose sharply, from 6,267 to 9,602: compare it with care.
| Specialty | Period 4, 2025-26 | Period 4, 2026-27 | Change (points) | More than a year, 2025-26 | More than a year, 2026-27 |
|---|---|---|---|---|---|
| Ophthalmology | 15.4% | 12.0% | −3.4 | 188 | 259 |
| Urology | 22.8% | 18.1% | −4.7 | 525 | 303 |
| Other procedures under general anesthesia | 28.1% | 19.8% | −8.3 | 283 | 245 |
| General surgery | 24.8% | 19.8% | −5.0 | 964 | 506 |
| Vascular surgery | 17.8% | 20.3% | +2.5 | 46 | 69 |
| Obstetrics and gynecology | 22.1% | 20.7% | −1.4 | 431 | 187 |
| ENT and head and neck surgery | 26.1% | 22.0% | −4.1 | 790 | 543 |
| Neurosurgery | 26.4% | 24.5% | −1.9 | 162 | 98 |
| Orthopedic surgery | 33.6% | 26.9% | −6.7 | 1,955 | 968 |
| Plastic surgery | 36.0% | 37.9% | +1.9 | 725 | 644 |
8. What this ranking does not tell you
It does not tell you how long you will wait. It describes the whole list at one moment, not a particular patient.
It also leaves out the earlier waits: the data only measures the time between the surgeon's decision and the surgery. It cannot measure the time needed to see a family doctor or a specialist first.
To know where you stand, ask your surgeon's office or the hospital where you are on the list.
9. Frequently asked questions
Frequently asked questions about surgery wait times in Quebec.
When does the wait start being counted?
From the surgeon's decision to operate. The time spent earlier to get an appointment with a family doctor or a specialist is not measured.
Why are Mauricie and Centre-du-Québec not in the table?
Because the Ministry of Health's file contains no figures for this region for the latest period. We add the region again as soon as its figures are published.
How often is the ranking updated?
The Ministry of Health updates its file at the end of each financial period, 13 times a year. We check it every month and change the tables and dates in this guide when new figures are published.
Why did the number of people waiting drop so much between period 1 and period 2 of 2026-27?
The number went from 137,905 to 124,096. More than half of this drop comes from the fact that Mauricie and Centre-du-Québec, which had 7,263 people waiting at period 1, are no longer in the file from period 2 on. Without that region in both periods, the number goes from 130,642 to 124,096. That is why the comparisons in this guide leave that region out of every period.
10. See also
These related guides may be useful:
- Seeing a doctor in Quebec — the first step before being referred to a specialist.
- Emergency room wait times — the other ranking based on Ministry of Health data.
- Registering with the RAMQ — the health insurance card you need for care.
11. Official sources
Author's note: If you are on a waiting list, keep the hospital's contact details and tell them if your phone number or address changes, so they can reach you when your date comes.