From April 1, 2026, to the end of period 7 of the fiscal year, patients who did not need a stretcher spent an average of 5.1 hours in Quebec's emergency rooms, from arrival to departure, according to Ministry of Health data. Among regions, it ranges from 2.3 hours in Nord-du-Québec to 6.2 hours in Laval and Laurentides; among Montréal's general hospitals, from 4.2 hours to 9.0 hours. In the 103 emergency rooms present in the file every year since 2021-22, this time went from 4.8 hours in 2025-26 to 5.1 hours in 2026-27, for the same part of the year. If your life is in danger, go to the nearest emergency room, whatever its ranking.
1. How this ranking works
This ranking compares one thing only: the average time spent in the emergency room by patients who are not on a stretcher. These are the people who wait in the waiting room. The time runs from arrival to departure, and includes people who were redirected and those who left before seeing a doctor, according to the Ministry of Health's methodology notes. Lower is better.
The figures come from the Ministry of Health's cumulative emergency room data file, published on Données Québec. We used the figures from April 1, 2026, to the end of period 7 of the 2026-27 fiscal year, read on November 4, 2026. The file is updated at each financial period, 13 times a year, and we update this ranking each month. The table also shows the average time between triage and seeing a doctor, for information. The ranking itself only uses the first number. We receive no payment from any hospital.
The same file gives the figures of the five previous years for the same part of the year. Sections 4 to 6 compare this year with past years.
2. The ranking by region
Across Quebec, patients who were not on a stretcher spent an average of 5.1 hours in the emergency room. The Mauricie and Centre-du-Québec region does not appear in the file for this year, so it is not in the table. When two regions show the same time, they share the same rank.
| Rank | Region | Average time in the ER (no stretcher) | Average time before seeing a doctor | Visits without a stretcher |
|---|---|---|---|---|
| 1 | Nord-du-Québec | 2.3 h | 0.9 h | 12,019 |
| 2 | Bas-Saint-Laurent | 3.6 h | 2.5 h | 59,115 |
| 2 | Gaspésie–Îles-de-la-Madeleine | 3.6 h | 2.1 h | 43,043 |
| 4 | Chaudière-Appalaches | 3.9 h | 2.5 h | 101,808 |
| 5 | Capitale-Nationale | 4.0 h | 2.6 h | 149,333 |
| 6 | Saguenay–Lac-Saint-Jean | 4.4 h | 3.4 h | 71,216 |
| 7 | Abitibi-Témiscamingue | 4.7 h | 3.3 h | 49,539 |
| 7 | Côte-Nord | 4.7 h | 3.4 h | 41,207 |
| 9 | Estrie | 5.5 h | 4.4 h | 92,480 |
| 10 | Montréal | 5.6 h | 3.5 h | 253,869 |
| 11 | Lanaudière | 5.9 h | 4.4 h | 61,953 |
| 12 | Montérégie | 6.0 h | 5.2 h | 135,801 |
| 12 | Outaouais | 6.0 h | 4.5 h | 64,704 |
| 14 | Laurentides | 6.2 h | 5.0 h | 77,350 |
| 14 | Laval | 6.2 h | 5.0 h | 30,841 |
3. Montréal: the general hospitals
This table only includes Montréal's general hospitals. The children's emergency rooms (CHU Sainte-Justine and the Montreal Children's Hospital), the psychiatric ones (Douglas and the Institut universitaire en santé mentale de Montréal) and the Montreal Heart Institute are left out: their patients are not comparable with those of a general emergency room. The emergency rooms of the Nord-de-l'Île-de-Montréal are not in the file for this year.
| Rank | Hospital | Average time in the ER (no stretcher) | Average time before seeing a doctor | Visits without a stretcher |
|---|---|---|---|---|
| 1 | Hôpital général juif | 4.2 h | 3.1 h | 21,800 |
| 2 | Hôpital de Lachine | 4.9 h | 3.8 h | 9,320 |
| 3 | Hôpital de Verdun | 5.0 h | 3.0 h | 17,378 |
| 4 | Hôpital Santa Cabrini | 5.1 h | 4.9 h | 11,876 |
| 5 | Hôpital Notre-Dame | 5.5 h | 3.1 h | 14,071 |
| 6 | Hôpital Maisonneuve-Rosemont | 5.8 h | 6.3 h | 25,375 |
| 6 | Hôpital général de Montréal | 5.8 h | 2.5 h | 11,102 |
| 8 | Centre hospitalier de St. Mary | 5.9 h | 3.7 h | 11,354 |
| 9 | Hôpital de LaSalle | 6.1 h | 4.5 h | 11,953 |
| 10 | Hôpital général du Lakeshore | 7.0 h | 4.5 h | 12,870 |
| 11 | CHUM (Centre hospitalier de l'Université de Montréal) | 7.7 h | 5.2 h | 26,435 |
| 12 | Hôpital Royal Victoria | 9.0 h | 6.3 h | 16,458 |
4. Compared with previous years
The Ministry of Health's file also gives the figures for the five previous years, for the same part of the year: from April 1 to the end of period 7. So this year can be compared with past years. The file does not give each period separately: it is not possible to compare one period with the one before.
Not every emergency room is in the file every year. In 2026-27, Mauricie and Centre-du-Québec are missing, as are four emergency rooms in the Nord-de-l'Île-de-Montréal; until 2024-25, Nord-du-Québec was missing. To compare the same emergency rooms from one year to the next, we recalculated the average using the 103 emergency rooms present in all six years, the same way the Ministry does: each emergency room's average, weighted by its number of visits. With all emergency rooms, this calculation gives exactly the official averages.
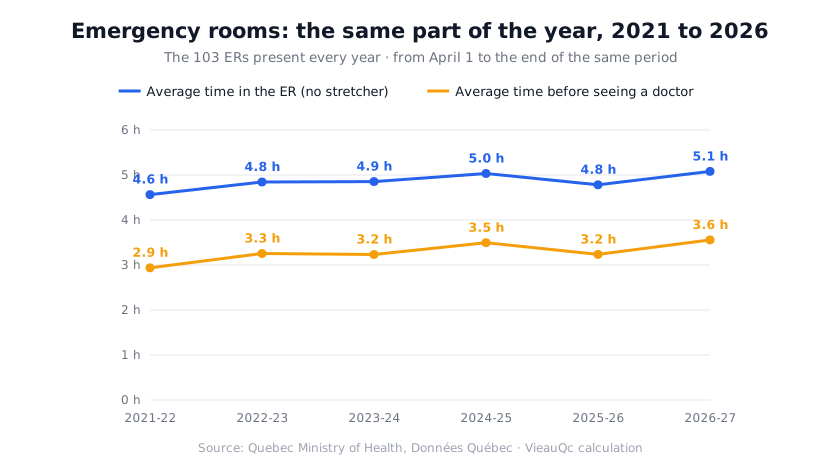
In these 103 emergency rooms, the average time spent in the ER without a stretcher went from 4.8 hours in 2025-26 to 5.1 hours in 2026-27; it was 4.6 hours in 2021-22. The average time before seeing a doctor went from 3.2 to 3.6 hours. Patients on a stretcher stay much longer: 17.1 hours on average in 2026-27, compared with 16.3 hours a year earlier.
| Year | Official Quebec average | Same 103 ERs: time in the ER (no stretcher) | Time before seeing a doctor (103 ERs) | Stay of stretcher patients (103 ERs) |
|---|---|---|---|---|
| 2021-22 | 4.6 h | 4.6 h | 2.9 h | 16.4 h |
| 2022-23 | 4.9 h | 4.8 h | 3.3 h | 17.9 h |
| 2023-24 | 4.9 h | 4.9 h | 3.2 h | 16.9 h |
| 2024-25 | 5.1 h | 5.0 h | 3.5 h | 16.8 h |
| 2025-26 | 4.8 h | 4.8 h | 3.2 h | 16.3 h |
| 2026-27 | 5.1 h | 5.1 h | 3.6 h | 17.1 h |
5. Each region, compared with last year
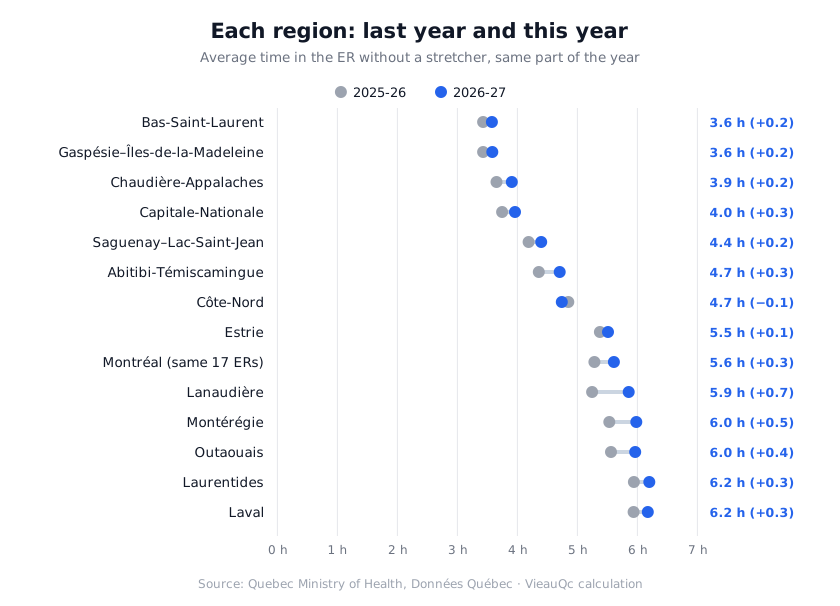
The table compares each region with the same part of the year in 2025-26 and in 2021-22. The average time in the ER without a stretcher went up in 13 of the 14 comparable regions; it went down only in Côte-Nord (−0.1 hour). The largest increases: Lanaudière (+0.7 hour) and Montérégie (+0.5 hour).
For Montréal, the average is calculated with the 17 emergency rooms present in all six years, so without the four emergency rooms of the Nord-de-l'Île-de-Montréal. Mauricie and Centre-du-Québec are not in the file for 2026-27. For Nord-du-Québec, the file has one emergency room in 2025-26 and five in 2026-27: the two years cannot be compared.
| Region | 2021-22 | 2025-26 | 2026-27 | Change in one year |
|---|---|---|---|---|
| Bas-Saint-Laurent | 3.0 h | 3.4 h | 3.6 h | +0.2 h |
| Gaspésie–Îles-de-la-Madeleine | 3.0 h | 3.4 h | 3.6 h | +0.2 h |
| Chaudière-Appalaches | 2.9 h | 3.7 h | 3.9 h | +0.2 h |
| Capitale-Nationale | 3.7 h | 3.7 h | 4.0 h | +0.3 h |
| Saguenay–Lac-Saint-Jean | 3.4 h | 4.2 h | 4.4 h | +0.2 h |
| Abitibi-Témiscamingue | 4.3 h | 4.4 h | 4.7 h | +0.3 h |
| Côte-Nord | 3.7 h | 4.8 h | 4.7 h | −0.1 h |
| Estrie | 4.8 h | 5.4 h | 5.5 h | +0.1 h |
| Montréal (same 17 ERs) | 5.6 h | 5.3 h | 5.6 h | +0.3 h |
| Lanaudière | 6.0 h | 5.2 h | 5.9 h | +0.7 h |
| Montérégie | 5.2 h | 5.5 h | 6.0 h | +0.5 h |
| Outaouais | 3.9 h | 5.6 h | 6.0 h | +0.4 h |
| Laurentides | 6.3 h | 5.9 h | 6.2 h | +0.3 h |
| Laval | 4.9 h | 5.9 h | 6.2 h | +0.3 h |
| Mauricie and Centre-du-Québec | 4.2 h | 4.3 h | — | — |
| Nord-du-Québec | — | 3.1 h | 2.3 h | — |
6. Montréal's hospitals, compared with last year
Montréal's 12 general hospitals are in the file every year. Compared with 2025-26, the average time went up in 7 of the 12 hospitals. The largest increases: Hôpital de Verdun and Hôpital Royal Victoria (+0.7 hour each). It went down at Hôpital Santa Cabrini (−0.3 hour), Hôpital de Lachine and Centre hospitalier de St. Mary (−0.1 hour each).
| Hospital | 2021-22 | 2025-26 | 2026-27 | Change in one year |
|---|---|---|---|---|
| Hôpital général juif | 4.1 h | 3.8 h | 4.2 h | +0.4 h |
| Hôpital de Lachine | 4.1 h | 5.0 h | 4.9 h | −0.1 h |
| Hôpital de Verdun | 3.9 h | 4.3 h | 5.0 h | +0.7 h |
| Hôpital Santa Cabrini | 5.6 h | 5.4 h | 5.1 h | −0.3 h |
| Hôpital Notre-Dame | 5.9 h | 5.5 h | 5.5 h | 0.0 h |
| Hôpital Maisonneuve-Rosemont | 5.8 h | 5.3 h | 5.8 h | +0.5 h |
| Hôpital général de Montréal | 5.4 h | 5.6 h | 5.8 h | +0.2 h |
| Centre hospitalier de St. Mary | 5.0 h | 6.0 h | 5.9 h | −0.1 h |
| Hôpital de LaSalle | 6.2 h | 5.7 h | 6.1 h | +0.4 h |
| Hôpital général du Lakeshore | 7.5 h | 7.0 h | 7.0 h | 0.0 h |
| CHUM (Centre hospitalier de l'Université de Montréal) | 6.9 h | 7.2 h | 7.7 h | +0.5 h |
| Hôpital Royal Victoria | 7.7 h | 8.3 h | 9.0 h | +0.7 h |
7. What this ranking does not tell you
These are averages over several months, not the time you will wait today. At the emergency room, a nurse assesses each person at triage, and the most serious cases are seen first: your wait depends on the people who are there when you arrive.
Several things make the time spent in the emergency room longer, for example waiting for a specialist's opinion, for a hospital bed or for tests. This ranking is not a measure of the quality of care.
8. Before you go to the emergency room
If your life or a loved one's life is in danger, go to the nearest emergency room.
For a problem that is not urgent, Québec.ca lists other options than the emergency room, such as Info-Santé 811 and online appointments.
To see the situation right now, the government's Situation in emergency rooms page shows, for each emergency room, the estimated waiting time before seeing a doctor for a non-priority case. It also notes that some emergency rooms are not open 24 hours a day: check the hours before you go.
9. Frequently asked questions
Frequently asked questions about emergency room wait times in Quebec.
Is the ranking time the wait before seeing a doctor?
No. It is the whole stay, from arrival to departure. The time before seeing a doctor is the next column: it runs from triage to the first time a doctor takes charge of you, and it excludes people who left before seeing a doctor, according to the methodology notes.
Why is the children's hospital not in the Montréal table?
Because children's, psychiatric and cardiology emergency rooms receive different patients from a general emergency room, so their times cannot be compared. Their figures are in the Ministry of Health's data file.
How often is the ranking updated?
The Ministry of Health updates its file at each financial period, 13 times a year. We check it every month and change the tables and dates in this guide when new figures are published.
Why are the official average and the 103-ER average not always the same?
Because the official average counts every emergency room in the file that year, and that list changes: in 2026-27, Mauricie and Centre-du-Québec and four emergency rooms of the Nord-de-l'Île-de-Montréal are missing, while Nord-du-Québec has been added. The 103-ER average keeps the same emergency rooms every year: it is the one to look at to know whether the time spent in the ER is going up or down.
10. See also
These related guides may be useful:
- Seeing a doctor in Quebec — family doctor, walk-in clinic or online: the options before the emergency room.
- Surgery wait times by region — the other ranking based on Ministry of Health data.
- Mental health in Quebec — where to find help outside the emergency room.
11. Official sources
Author's note: This ranking is useful for planning, not for an emergency. If you are not sure whether your problem is urgent, Info-Santé 811 can tell you where to go.